VA Data Commons
The VA Data Commons supports the research and analysis of US military Veteran medical and genomic data and aims to accelerate scientific discovery and development of therapies, diagnostic tests, and other technologies for improving the lives of Veterans and beyond. The data commons features GWAS analyses on harmonized data.
Table of Contents
Getting Started
Login Page
Users will log in with their VA PIV credentials. Start by visiting the login page and sign in with your organizational account. After successfully logging in, your username will appear in the upper right-hand corner of the page. Click this link for more information about using the PIV login.
Once logged in, the user will see there are several options in the upper right hand corner of the home screen. In the blue bar at the top of the page, there is a link to VA Data Commons Documentation (the page you are currently reading), Email Support, your username and a log out button. Below these options, there are tabs for the Workspace, the Apps, and the Profile pages. Clicking on the VA Data Commons logo in the upper left hand corner of the screen will always return you to the home page of the data commons.
VA Data Commons Documentation
The button for VA Data Commons Documentation takes you to this page.
Email Support
If you need help, the Email Support button allows you to send a message to our help desk at vadc@lists.uchicago.edu. You may expect a response within 2 business days.
Data Access and Analysis
Workspace
Currently, workspaces are not available, and therefore you may see an error when attempting to log into this page. Generally, workspaces are secure data analysis environments in the cloud that can access data from one or more data resources. Workspaces may include Jupyter notebooks and JupyterLab, Python and RStudio. For more information about the Gen3 Workspace, you may refer to Gen3 Workspaces and Data Analysis in a Gen3 Data Commons.
Apps
The Apps page displays the option of four apps: OHDSI Atlas, Gen3 GWAS, GWAS Results and Data Dictionary. Using these Apps, a user may perform a genomic analysis on available data from projects that they have access to.
OHDSI Atlas
ATLAS is an open source software application developed as a part of OHDSI community intended to provide a unified interface to patient level data and analytics. Atlas software used to define cohorts, typically dichotomous variables, for analysis.
ATLAS currently includes functionality for searching and navigating the vocabulary within the OMOP Common Data Model (CDM). Users may link to the MVP Data Dictionary to help with comprehension and curation of custom sets. In addition to the search and navigation capabilities, it also provides features to curate and export custom sets of concept identifiers for use in cohort definitions. These will automatically populate on the Gen3 GWAS App.
In general, ATLAS is an analytics platform that can be used to perform analyses across one or more observational databases which have been standardized to the OMOP Common Data Model V5 and can facilitate exchange of analysis designs with any other organizations across the OHDSI community.
Tutorials for the ATLAS tool can be found here and also in the MVP data dictionary link. The book about the OHDSI can be found here. These resources contain a lot of useful information, particularly you might find it useful to read about Cohort Definition. It is highly advisable that you familiarize yourself with these resources before proceeding.
Steps to Generate a Cohort
Step 1 Create a Concept Set
Concept Sets are a list of codes created by searching the standardized vocabulary and selecting the set of terms for your analyses. Here you select all concepts (variables) that you would like to use for criteria that define your study population cohort.
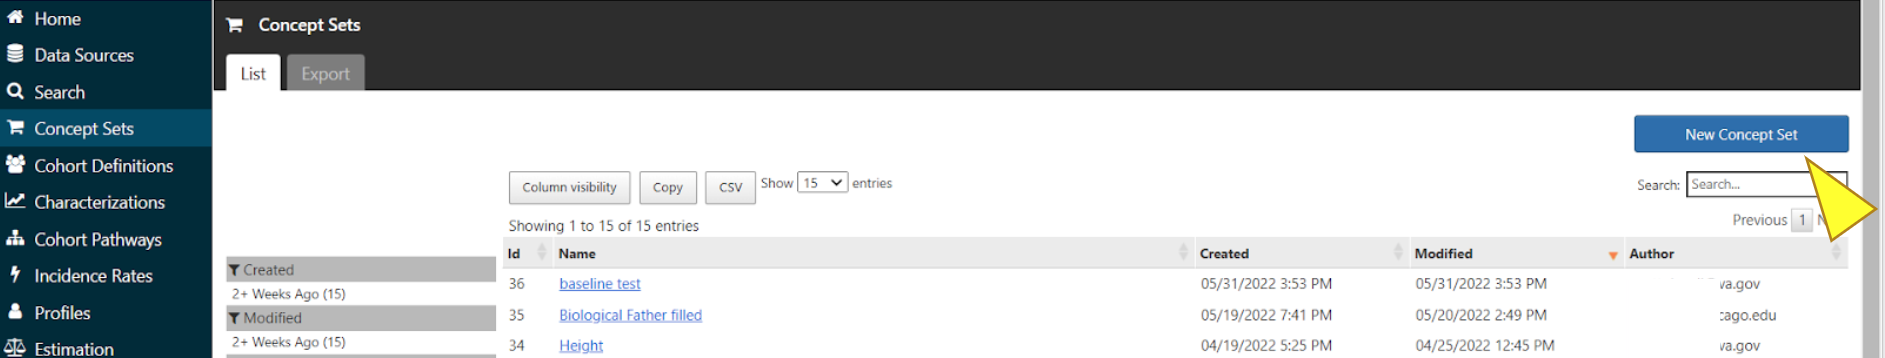
Select Concept Sets in the menu and click the blue box for “New Concept Set”.
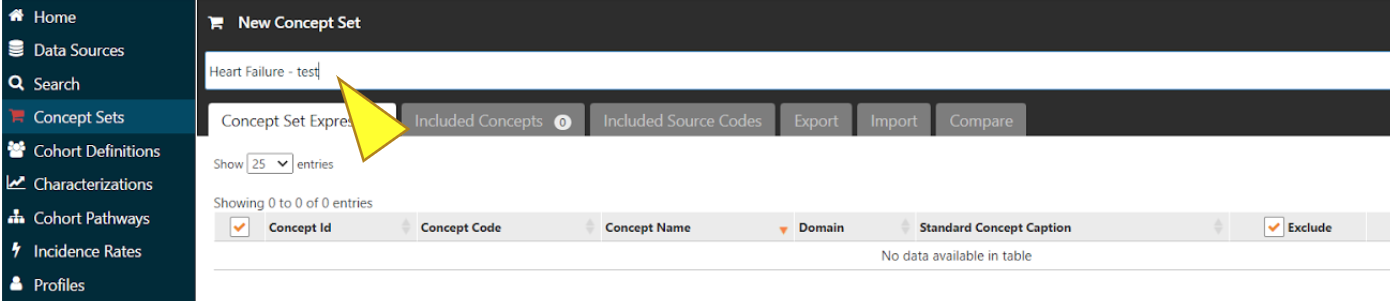
In the box above the tabs, enter a name for the Concept Set you are creating.
Click the green box “Add concepts” to view the list of concept variables.
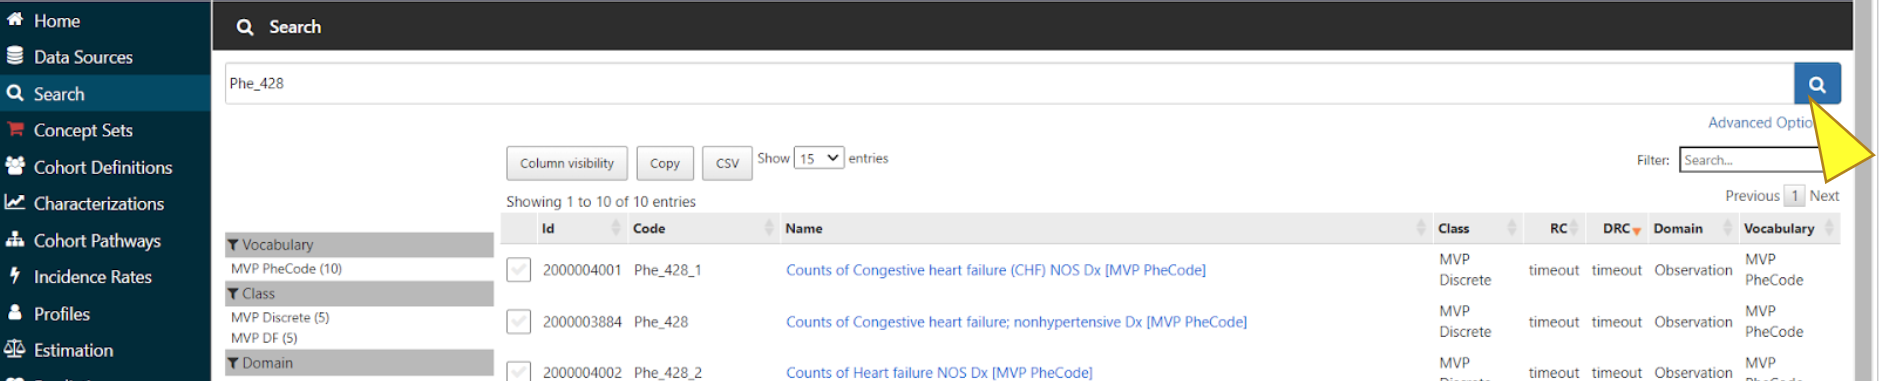
Enter the concept name or code into the search bar to find relevant concept variables.
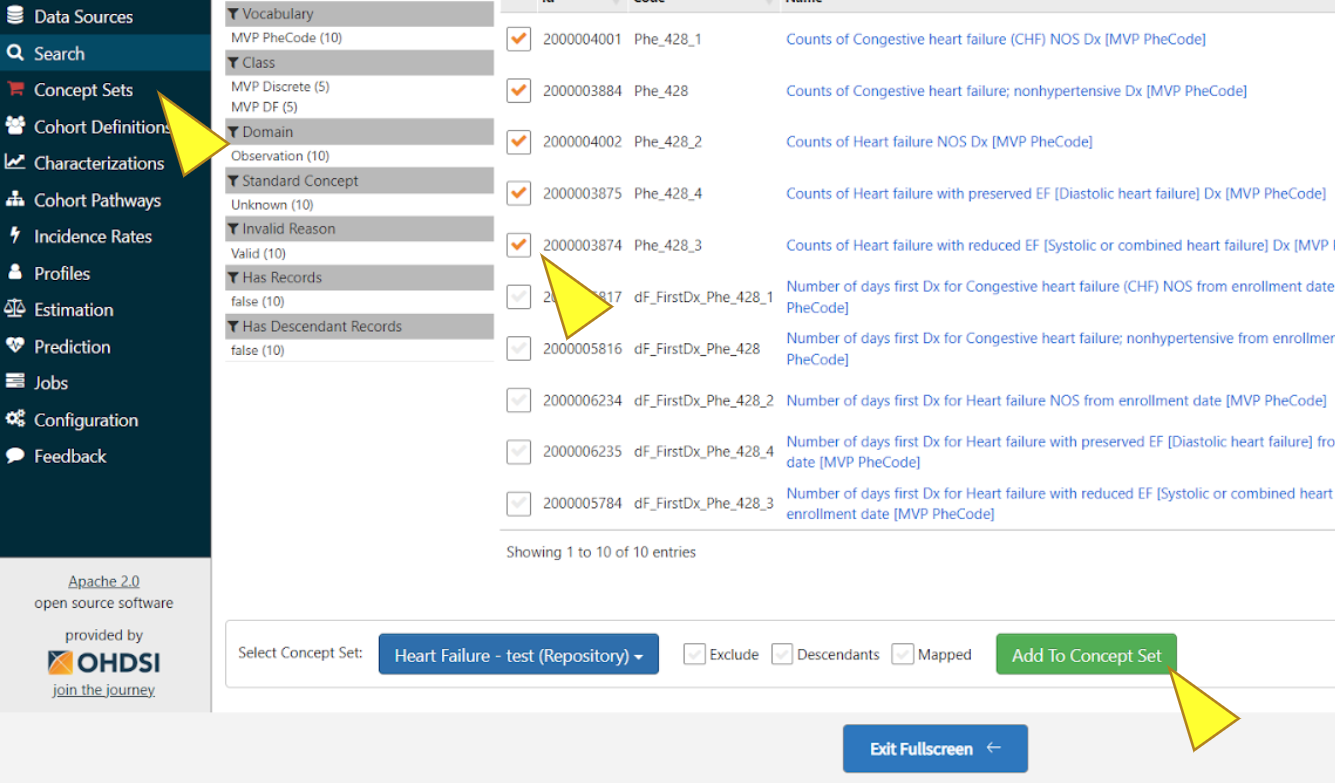
Select desired concepts, click “Add To Concept Set”. Repeat Search and Add steps as needed, then click “Concept Sets”.
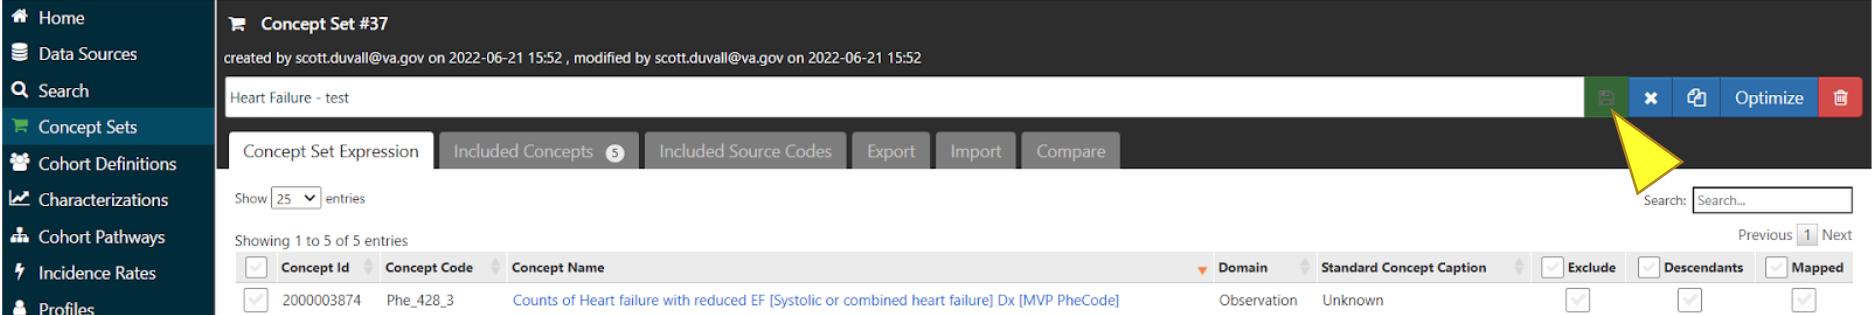
Make sure all desired concepts are included, then click the save icon to the right of the name of the Concept Set.
To add new concepts, please use the “Add Concepts” button again as described above.
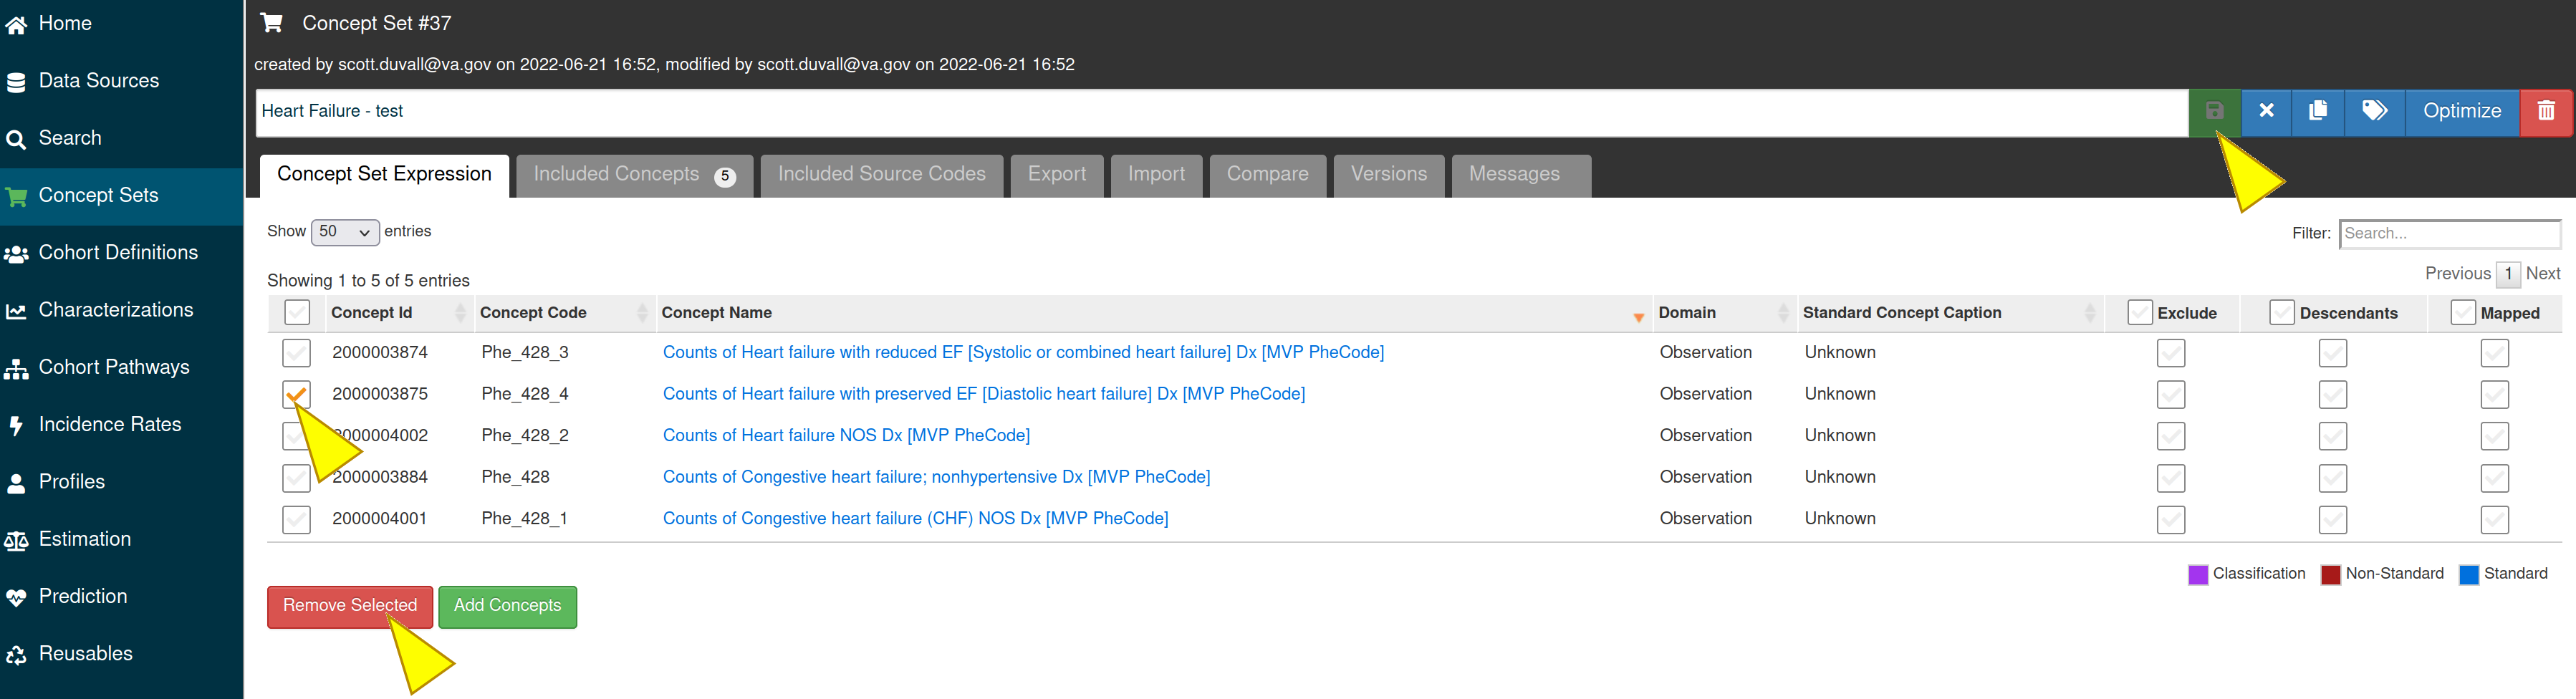
To delete the concepts from the concept set, select the concepts and click on the “Remove Selected” button, then click the save icon to save your changes.
Step 2 Create Cohort Definition
A cohort is a set of persons who satisfy one or more inclusion criteria for a duration of time.
Use the concept sets to create initial events and other criteria for defining the study population cohort. A cohort is defined as a Person with an entry and exit date. Thus, a person can be in a cohort multiple times if they meet the criteria.
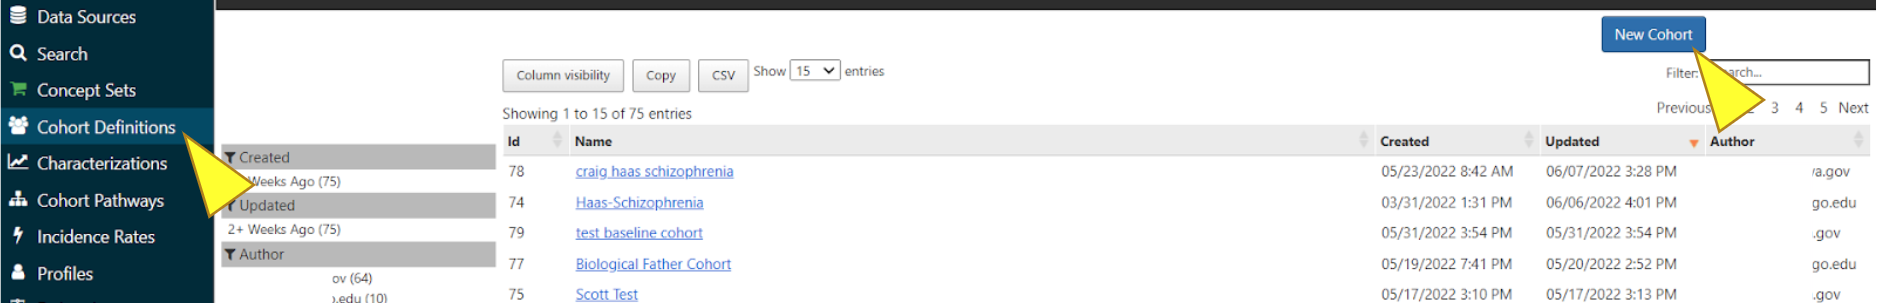
Select “Cohort Definitions” in the menu, you can begin to create a cohort by clicking the “New Cohort” button.
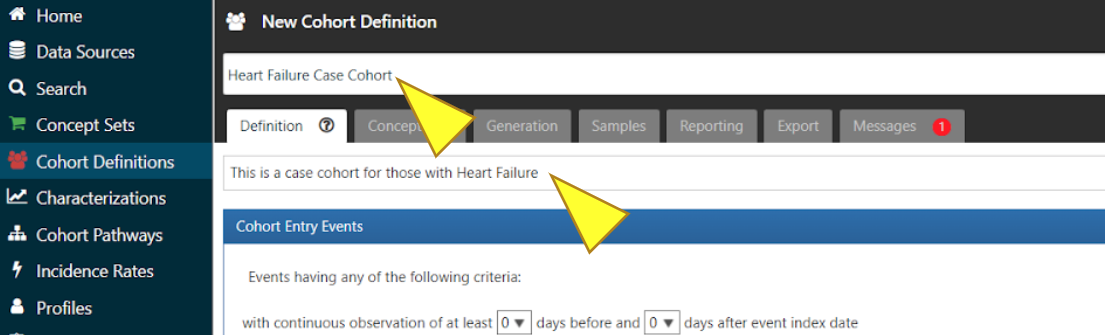
In the boxes above and below the tabs, enter a name and description for the Cohort.
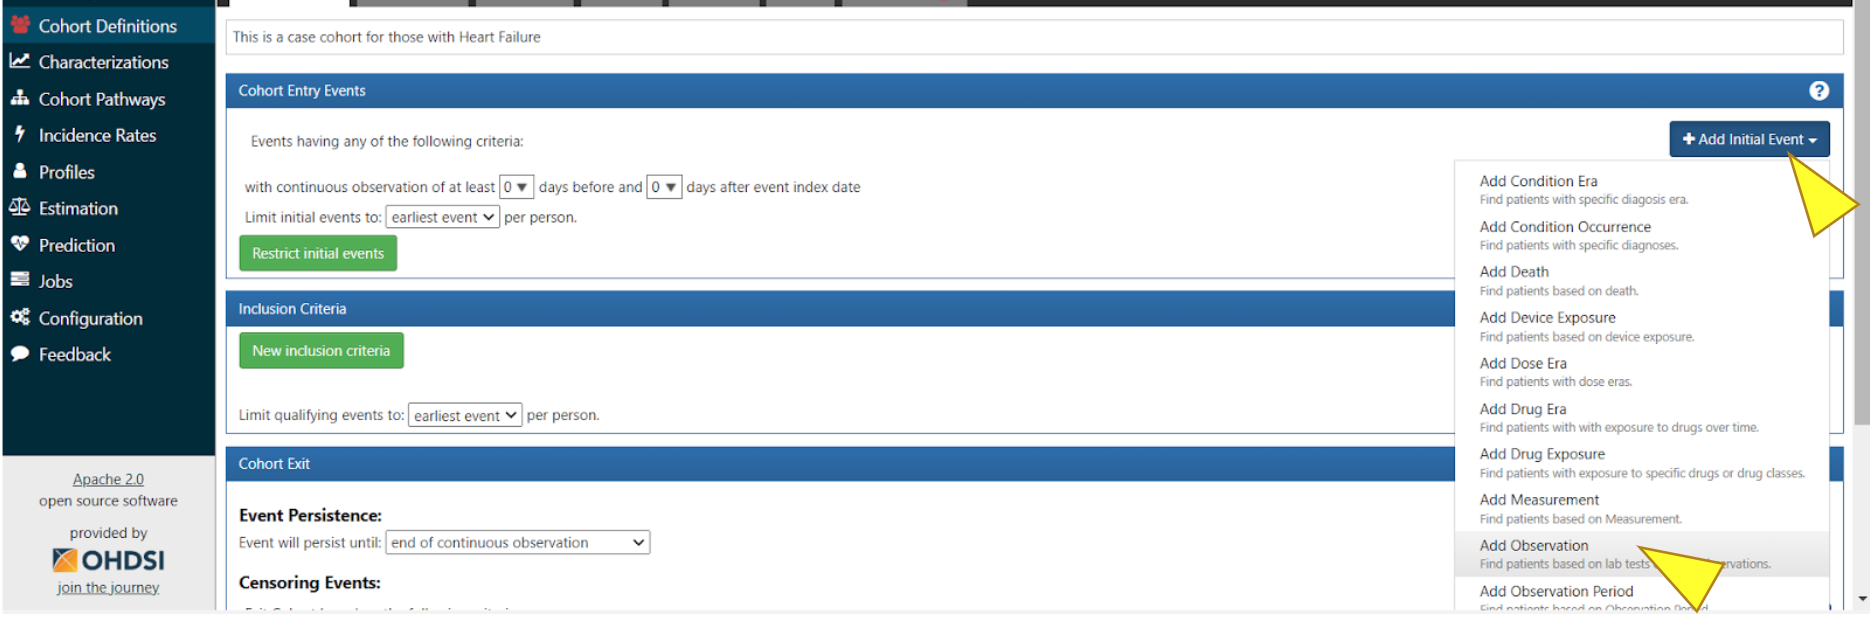
To establish the duration for your cohort, click “+ Add Initial Event”, then in the dropdown menu click “Add Observation”.
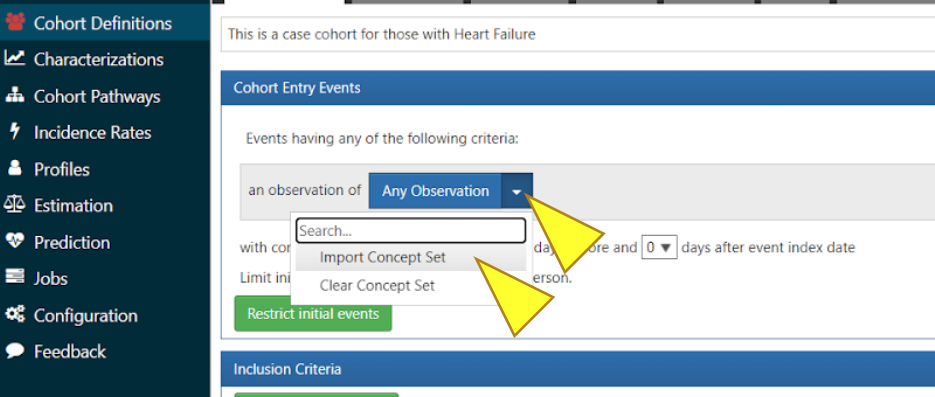
Click the blue box “Any Observation”, select “Import Concept Set” from the dropdown menu.
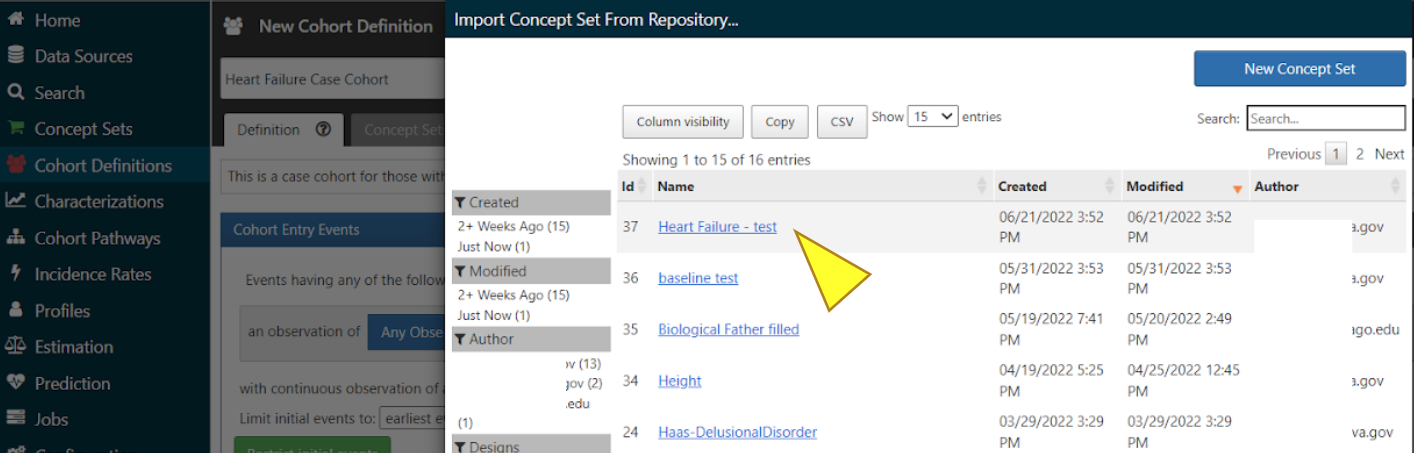
Select the Concept Set you just made. This establishes your Concept Set as inclusion criteria for your cohort.
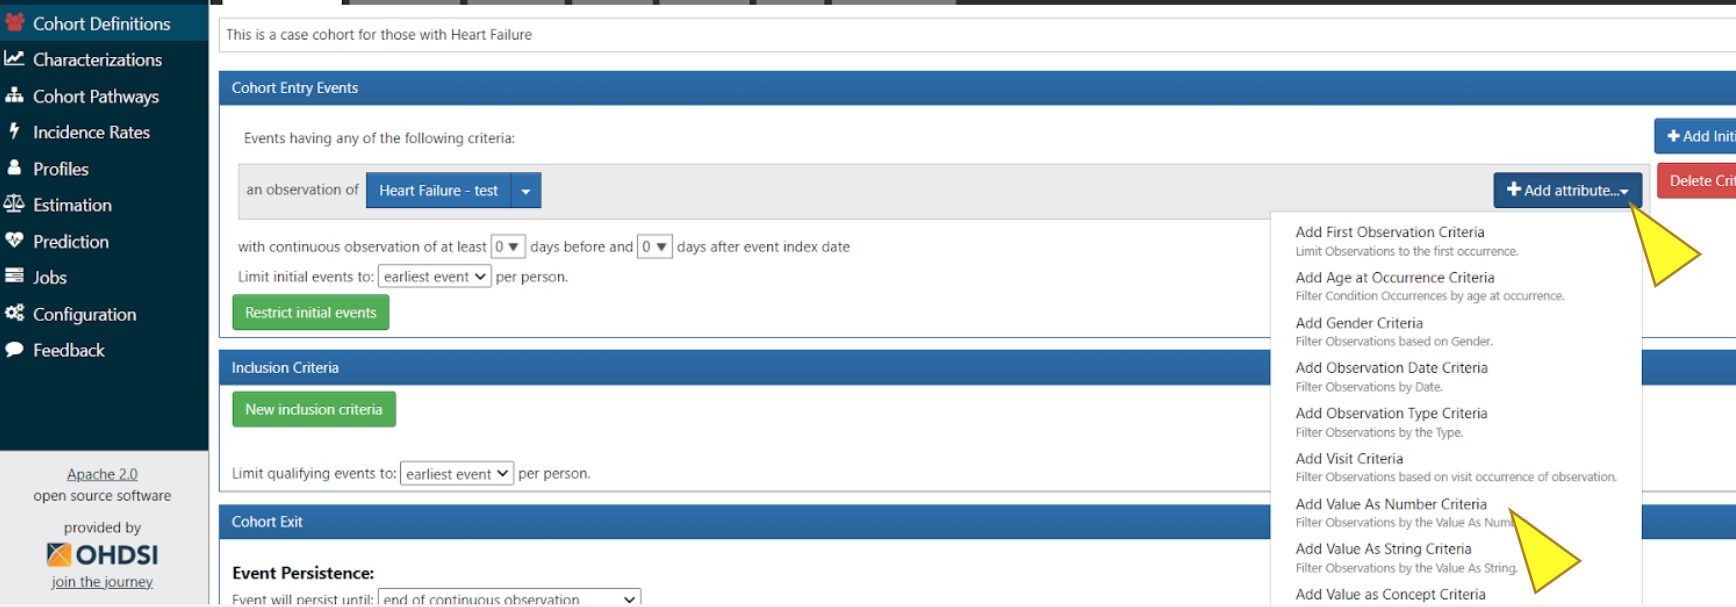
To access the table in the MVP harmonization database, click “+ Add attribute…”, then click “Add Value as Number Criteria”.
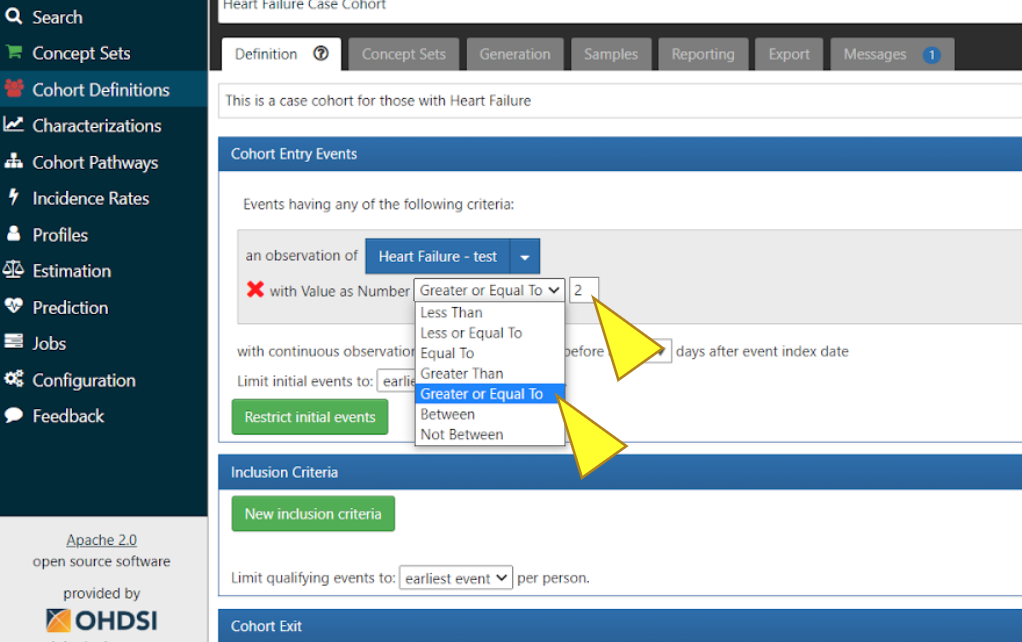
Select “Greater or Equal To”. In this specific case we added Heart Failure concept Set and entered value “2”. This will allow for the collection of data from the Observation table of the MVP harmonization database.
If you would like to add additional inclusion criteria, click “New inclusion criteria” select criteria or import another configuration. To complete the Cohort Definition, click the green Save icon.
Step 3 Generate Cohort
Once created, the cohort can then serve as the basis of inputs for your subsequent analyses. Use the cohort definition to identify how many people are in the cohort. This is the initial number that will be used in the GWAS App when this cohort is selected.
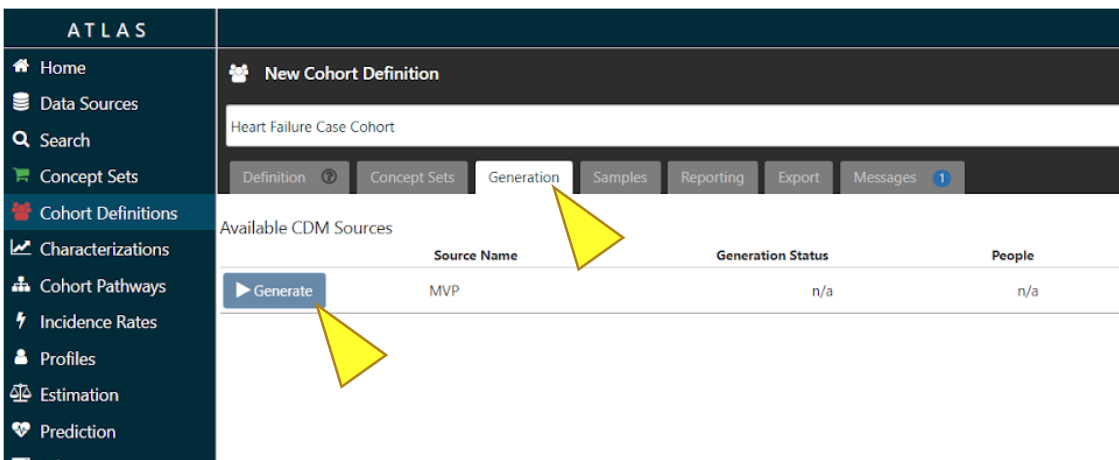
To complete the creation of the Cohort Definition, click “Generation”, then “Generate”.
Cohort size will be displayed under the column “People”. Use View Reports to see if you have inclusion criteria that causes cohort attrition.
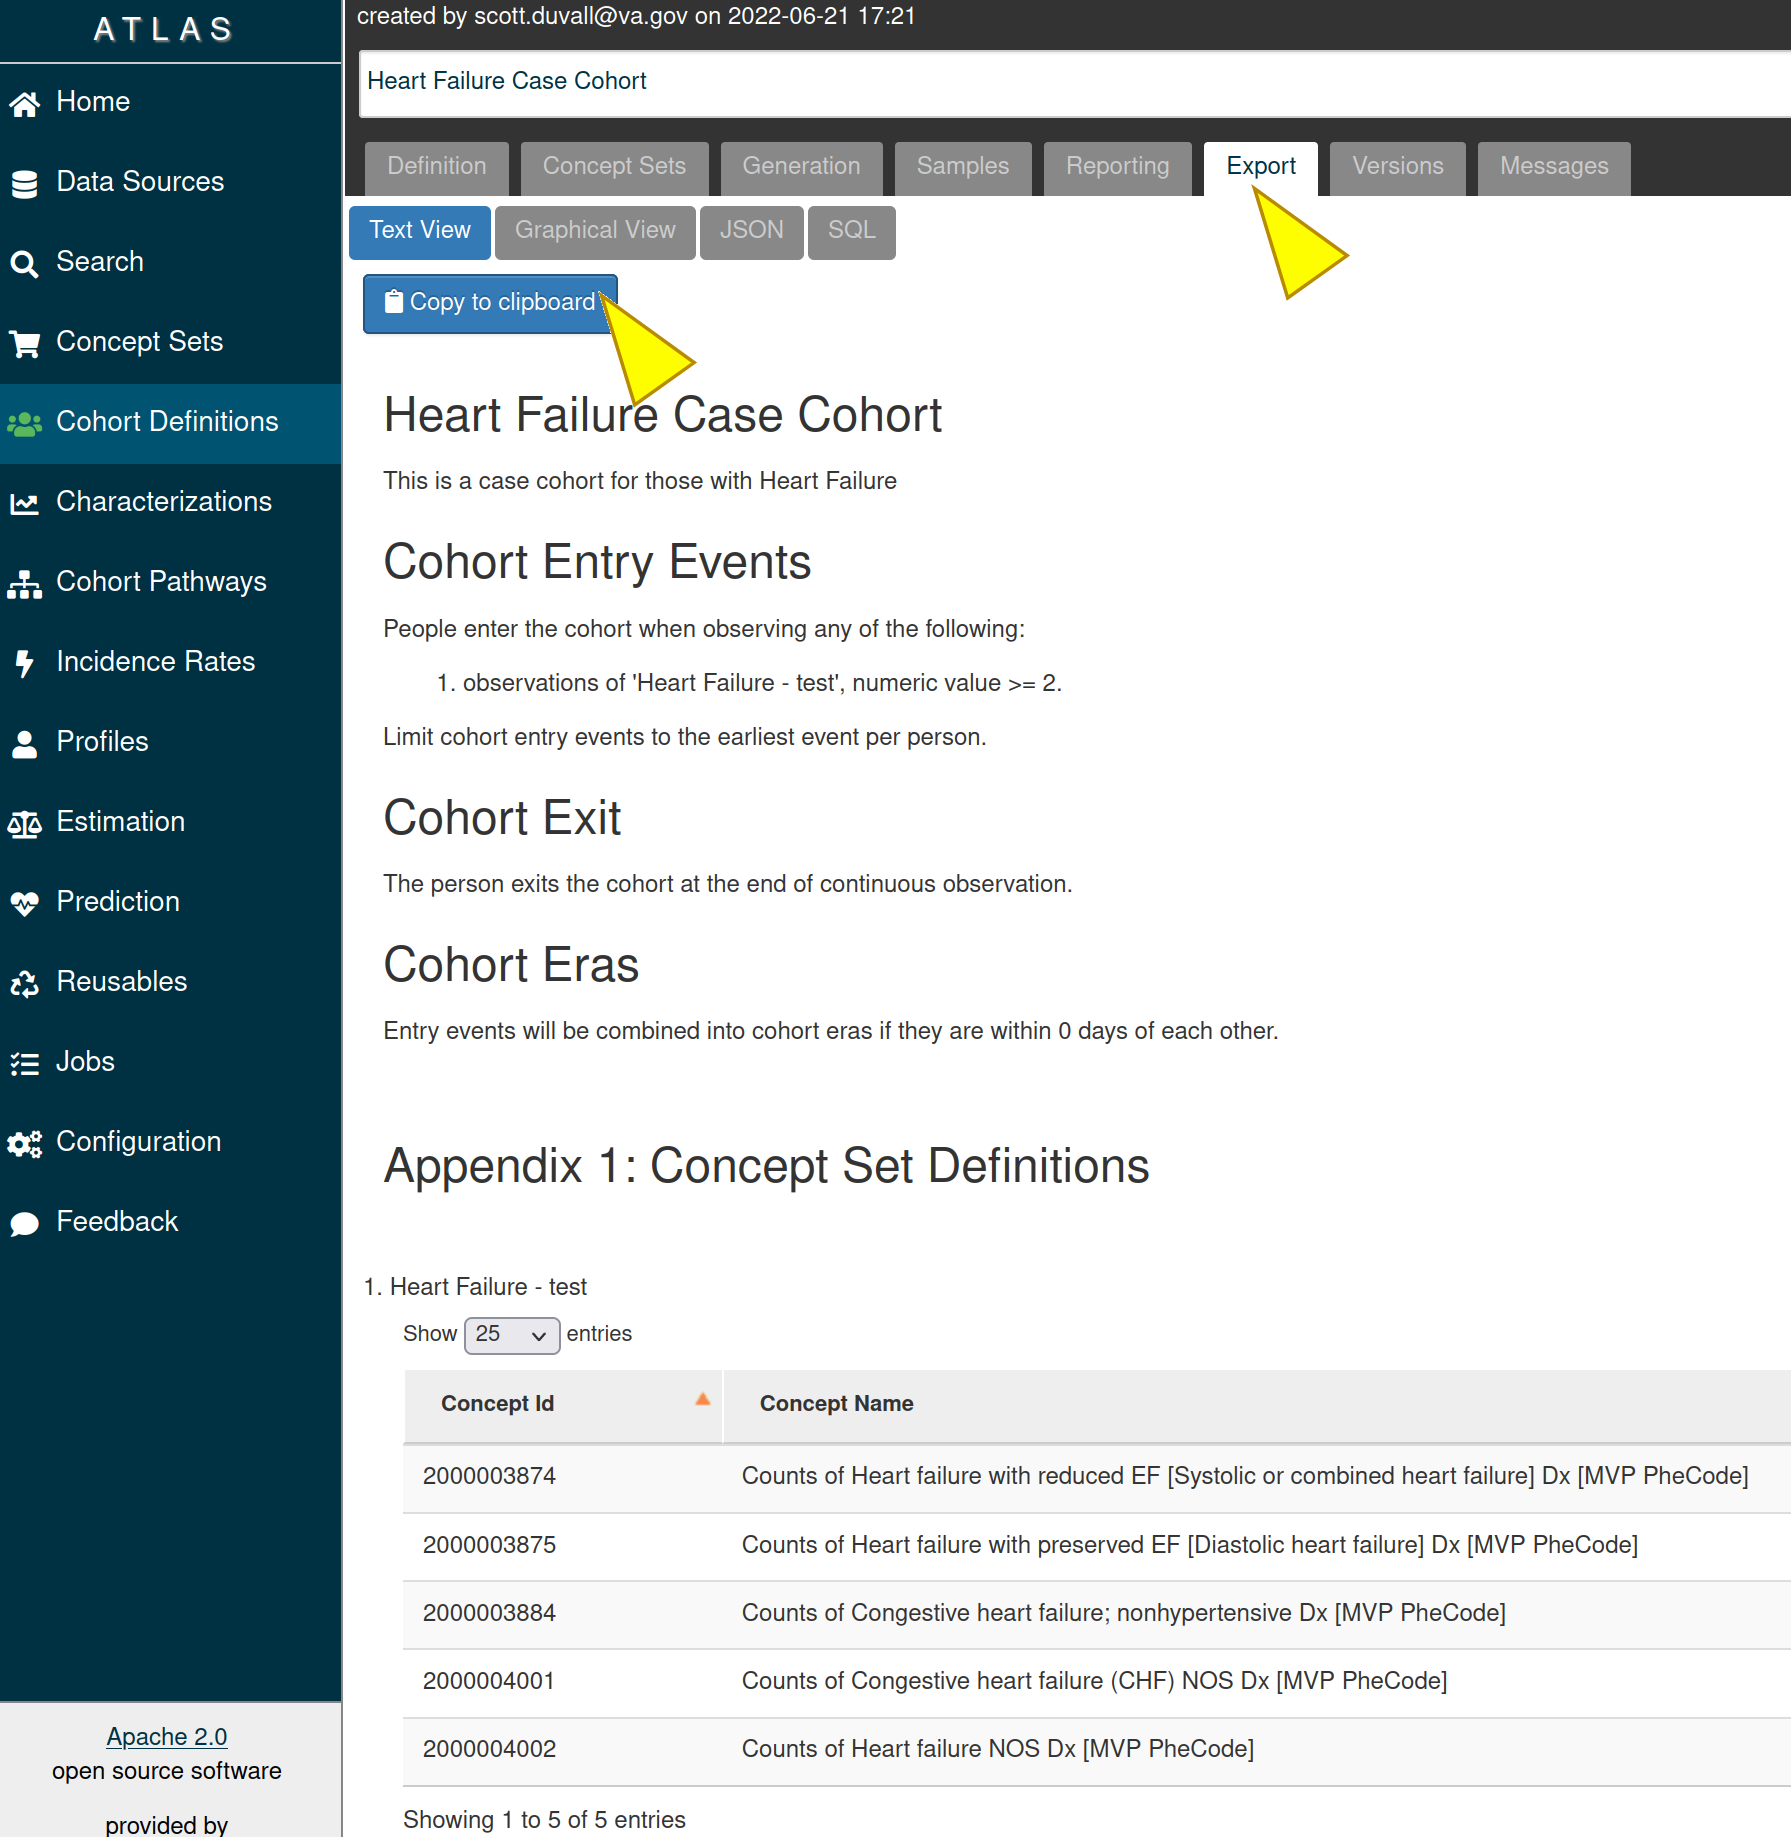
The “Export” tab provides a text version of how a cohort was created. Click on the “Export” tab and then on the “Copy to clipboard” to copy the cohort’s information.
We expect that this documentation in addition to the OHDSI tutorials are sufficient for most analyses that users will attempt. If you have any questions, please contact us at vadc@lists.uchicago.edu.
Gen3 GWAS
Use this App to perform a high throughput Genome-wide association studies (GWAS) on MVP data using the University of Washington Genesis pipeline. For more information about the Genesis pipeline please refer to the publication “Genetic association testing using the GENESIS R/Bioconductor package”.
GWAS helps scientists identify genes associated with a particular disease (or another trait). This method studies the entire set of DNA (the genome) of a large group of people, searching for small variations called single nucleotide polymorphisms or SNPs (pronounced “snips”).
GWAS App consists of several steps. To navigate between the steps, click the Next or Previous box in the lower corners of the screen.
Each step displays the Attrition table at the top of the page. The Attrition table contains information about the total population size and sample size by ancestry for your selected cohorts and variables.
For more information about the web functionality of each step, please refer to the button “New to GWAS? Get started here”. This tool will offer highlighted explanations on different parts of the page.
Genome-Wide Association Studies (GWAS) Steps
Tip: On each step of the workflow there is a tutorial button called
"New to GWAS? Get started here", please click the button to navigate through the tutorial
Step 1 Select Study Population
In this step, you will determine the study population. To begin, select the cohort that you would like to define your study population with. You may only see cohorts that you have access to. You may only select one cohort. The size of the cohort population is indicated on the right-hand side of the table. To browse the table, please scroll down to the bottom. To search for a cohort by name you may use the search box.
Once a cohort has been chosen, it will populate the attrition table above.
You may also see the button “Add a new cohort”. This button will open a new tab in your browser outside of the Gen3 GWAS App and send you to the OHDSI Atlas App, where you may create a new cohort.
Step 2 Select Outcome Phenotype
In this step, you will determine your outcome phenotype.
There are two options available: Continuous Outcome Phenotype and Dichotomous Outcome Phenotype.
Continuous Outcome
Here, you may choose your continuous phenotype. GWAS App provides over 500 variables for your selection, for example, height, weight, blood pressure, white blood cell, and other clinical observations. Please select the outcome phenotype you wish to use in your model. All data are harmonized from different projects through the collaborative development of a data dictionary. To browse the table, please scroll down to the bottom.To search the table, please enter free text in the search box to search by phenotype name. In the plot near the table, you can learn more about the selected outcome distribution in the study population. After you select your outcome, click “Submit” to apply it for your model. After clicking ‘Submit’ you may see the selection in your attrition table.
Dichotomous Outcome
Here, you may choose your dichotomous outcome phenotype. You can define your outcome by intersecting your study population with two other cohorts. Please enter the name for your outcome variable in the field “Phenotype name”. You can select your control (or No, 0) cohort in the field “Get Value 0”, and your case cohort (or Yes, 1) in the field “Get Value 1”. The Euler diagram on the right-hand side of the page shows the overlap between your chosen cohorts and study population, with numbers indicating the size of the overlap. After you define your outcome phenotype, click “Submit” to apply it to your model. It will then populate the attrition table and take you to the next step.
Step 3 Select Covariate Phenotype
This step is optional. In this step, you can add the harmonized continuous covariates or dichotomous covariates by clicking on the corresponding button.
Add Continuous Covariate
GWAS App provides over 500 variables for your selection, for example, height, weight, blood pressure, white blood cell, and other clinical observations. Please select all covariates you wish to use in your model. You may choose as many covariates as you wish in this step. To browse the table, please scroll down to the bottom.To search the table, please enter free text in the search box to search by the covariate name. You can learn more about the selected covariate distribution in the study population in the plot near the table. After you select your covariate, click “Add” to apply it to your model. The covariate will then appear on the right-hand side of the screen and populate the attrition table. You can delete previously chosen covariates by clicking on the Delete icon.
Add Dichotomous Covariate
You may add custom dichotomous covariates by selecting two cohorts. Please enter the name for your covariate variable in the field “Covariate name”. You can select your control (or No, 0) cohort in the field “Get Value 0” and your case cohort (or Yes, 1) in the field “Get Value 1”. The Euler diagram on the right-hand side of the page shows the overlap between your chosen cohorts and study population with numbers indicating the size of the overlap. After you define your covariate, click “Add” to apply it to your model. The covariate will then appear on the right-hand side of the screen and populate the attrition table. You can delete previously created covariates by clicking on the Delete icon.
Step 4 Configure GWAS
In this step, you will determine workflow parameters. Please adjust the number of population principal components (PCs) to control for population structure, minor allele frequency cutoff, and imputation score cutoff. Please also choose one ancestry population on which you would like to perform your study.
Number of PCs - Population Principal components (PCs) refer to linear combinations of genome-wide genotyping data to control for population structure/stratification (select up to 10 PCs).
Harmonized Ancestry and Race/Ethnicity (HARE) dropdown menu - Please choose the ancestry population on which you would like to perform your study. The numbers appearing in the dropdown represent the population size of your study, considering all of your previous selections. You may not proceed with the analysis without a selection.
MAF Cutoff- Minor allele frequency (MAF) is the frequency at which the second most common allele occurs in a given population and can be used to filter out rare markers (scale of 0-0.5).
Imputation Score Cutoff - This value reflects the quality of imputed SNPs and can be used to remove low-quality imputed markers (scale of 0-1). Once you have selected your values please press Next.
Submission Modal and Additional Options
Once step 4 is concluded, you may review your details in a modal. This will present to you the configurable selections made in every step of the GWAS flow.
Configurable values - May be changed in step 4.
Covariates - Please review the chosen covariates. To remove unwanted covariates, or change them, please go back (at the bottom of the page) to step 3.
Outcome Phenotype - Please see here the outcome phenotype chosen in step 2. To remake the selection please go back (at the bottom of the page) to step 2.
Cohort - This represents the study population you selected. To change your selection please go back to step 1.
Once you have reviewed your selections you must give a name to your analysis, followed by pressing ‘Submit’.
Once the job is submitted, a success message will then appear on the screen with the given job name and GWAS job id. You may progress in three different paths-
See status - This option will send you to a different page where you may review the status of your job.
Submit new workflow - This option will send you to the beginning of the GWAS App where you may submit a different GWAS for analysis.
Submit similar (stay here) - This option will keep you at this page, where you may be able to submit some changes to the GWAS you already built and submit a similar job.
Check Submission Status and Review Results
Once your GWAS analysis is submitted, you can check the Submission Status and Review the Results in the “GWAS Results” App.
GWAS Results
This app is used to view your job status and results.
The landing page displays a table of submitted jobs including the Run ID of your analysis, the workflow name, the start time, and the finish time. The table may be sorted by any column by clicking on the up or down arrows next to the column name. The “Manage columns” button in the upper right corner can be used to toggle the display of any column.
Three additional columns are displayed by default: job status, details, and actions. The details columns lists additional information about your submitted job. The Input button links to your GWAS job configuration options and the execution button presents information about the execution of your GWAS job including messages from log files. The job status column provides information about the execution status of your job. The displayed values are:
Pending - your analysis was placed in the queue to run, depending on the length of the queue your analysis could start in the range of several minutes to several hours
In Progress - your analysis has started and is running, depending on your selection of cohort and variables it could finish in the range of half an hour to three hours
Failed - your analysis returned an error and could not run to completion. Please see Troubleshooting GWAS Errors below.
Completed - your analysis was successfully completed and you may download the results of the GWAS analysis from this menu
Once completed, you may review the output from your submission by clicking on the “Results” button in the details column. The results landing page includes an interactive Manhattan plot, viewable QQ plot, and a searchable table of the Top Loci. The Manhattan plot may be downloaded separately as a png format file and the Top Loci table as a tsv file. Clicking on the Download All Results button at the top of the results page will prompt the creation and download of your workflow results to your computer. Depending on your cohort and variables selection, the file size can vary in the range of 700MB up to 1.3GB. The file contains the following:
Manhattan plot (.png)
QQ plot (.png)
100 top hits (.csv.gz)
per-chromosome GWAS summary statistics (folder of .csv.gz’s)
all hits below p-value 5e-8 (.csv.gz)
your study’s attrition tables (folder of .csv’s)
a metadata file containing all of your selections (gwas_metadata.yaml)
Troubleshooting GWAS Errors
In the Results Viewer App we are beginning to add meaningful error messages. The messages will appear in the execution logs and will be as follow:
Failed run-null-model: Small cohort size or unbalanced cohort sizes.
Failed run-plots: Small cohort size or unbalanced cohort sizes
Failed run-null-model: Small cohort size or unbalanced cohort sizes
The cohort size chosen did not produce enough statistical power. As a rule of thumb, for continuous workflows a cohort size of about 700 or below may fail for this reason. If the user ran a dichotomous workflow, they should check that both the case and control cohort sizes are large enough, and are not vastly different in size (for example by two orders of magnitude or more). This can be checked through the attrition table in the GWAS App, prior to submission. The cohort size will reflect in the column where the chosen HARE is presented. A user may also see the choice they made in the GWAS Results by clicking on “Input”.
Failed run-plots: Small cohort size or unbalanced cohort sizes
The cohort size chosen did not produce enough statistical power. As a rule of thumb, for continuous workflows a cohort size of about 700 or below may fail for these reasons. If the user ran a dichotomous workflow, they should check that both the case and control cohort sizes are large enough, and are not vastly different in size (for example by two orders of magnitude or more). This can be checked through the attrition table in the GWAS App, prior to submission. The cohort size will reflect in the column where the chosen HARE is presented. A user may also see the choice they made in the GWAS Results by clicking on “Input”.
Failed run-single-assoc: Unbalanced cohort sizes
The cohort size chosen did not produce enough statistical power. As a rule of thumb, a cohort size of about 700 or below may fail for these reasons. If the user ran a dichotomous workflow, they should check that both the case and control cohort sizes are large enough. This can be checked through the attrition table in the GWAS App, prior to submission. The cohort size will reflect in the column where the chosen HARE is presented. A user may also see the choice they made in the GWAS Results by clicking on “Input”.
Failed generate-attrition-csv: Timeout occurred while fetching attrition table information. Please retry
A timeout error implies that an internal service was temporarily not available while fetching the information presented to the user on the UI. If you wish to re-run your job, you can do so by selecting “retry” from the Actions Menu.
Step failed with an uncategorized error
Many reasons can cause workflows to fail, and some of them may be transient. Please reach out to vadc@lists.uchicago.edu with any further questions. In your message please provide us with the serial name of your workflow and the step in which your GWAS failed (mentioned in your error message). A response should be expected with 2 business days.
MVP Data Dictionary
The Data Dictionary App connects users to the static MVP data documentation which contains definitions, descriptions, and metadata for the variables and concepts available in the VADC Atlas OHDSI and GWAS apps. This is also available through a link from the VADC Atlas OHSDI page. When selecting data dictionary from the Apps browser, the user will be presented with a button. This button directs the user to an outside tab. Clicking on the MVP Data Dictionary button will automatically launch a popup explaining that the link takes the user away from VADC. Clicking the “OK” button will open the dictionary in a new tab of the user’s browser allowing toggling between the two sites. Please note- the site can only be accessible within the VA’s VPN.
Data Update Disclaimer
Please note that we are constantly improving the GWAS pipeline. The retry action will re-run your analysis based on the most recent data available in the database and the most recent GWAS pipeline implemented. These may differ from the analysis you ran initially, and these differences might affect the outcome. For these reasons, the retry action is only applicable to failed workflows. If you have any questions, please feel free to contact us via email vadc@lists.uchicago.edu.
Frequently Asked Questions
Where can I find more documentation on the OHDSI Atlas app?
ATLAS was developed and is maintained by the OHDSI community. Tutorials for the ATLAS tool can be found here and the book about the OHDSI can be found here. These resources contain a lot of useful information, particularly you might find it useful to read about Cohort Definition. If you need help, please reach out to our help desk at vadc@lists.uchicago.edu
What are harmonized variables?
Data harmonization is the process of defining terms across different but similar projects. It helps to avoid inconsistencies in data reporting and makes it easier to find and analyze data. For example, different studies can have their unique names for the variable “date a participant enrolled”, like “index date”, “date of enrollment”, or “AnchorDate”. Those variables are harmonized, or mapped, to a single harmonized variable “enrollment date”.
What will be included in the downloadable package at the end of a GWAS?
The package contains the following: Manhattan plot, QQ plot, metadata file containing all of your selections, your study’s attrition table, and per-chromosome GWAS summary statistics.
How long will my GWAS take?
You may check the status of your analysis in the “GWAS Results” App. After you submit your analysis, it will be placed in the queue to run. The “GWAS Results” App will show the “Pending” status for your submitted analysis. Depending on the length of the queue, your analysis could start in the range of several minutes to several hours. After the analysis starts to run, the status will be changed to “In Progress”. Depending on your selection of cohort and variables, it could finish in the range of half an hour to three hours. You may close your browser after you submit the analysis.
Why does the workspaces page give me an error?
Currently, workspaces are not available, and therefore you may see an error when attempting to log into this page. Generally, workspaces are secure data analysis environments in the cloud that can access data from one or more data resources. Workspaces may include Jupyter notebooks and JupyterLab, Python and RStudio. For more information about the Gen3 Workspace, you may refer to Gen3 Workspaces and Data Analysis in a Gen3 Data Commons.